Recovery Economics
The Recovery Half Your Dashboard Doesn't Show
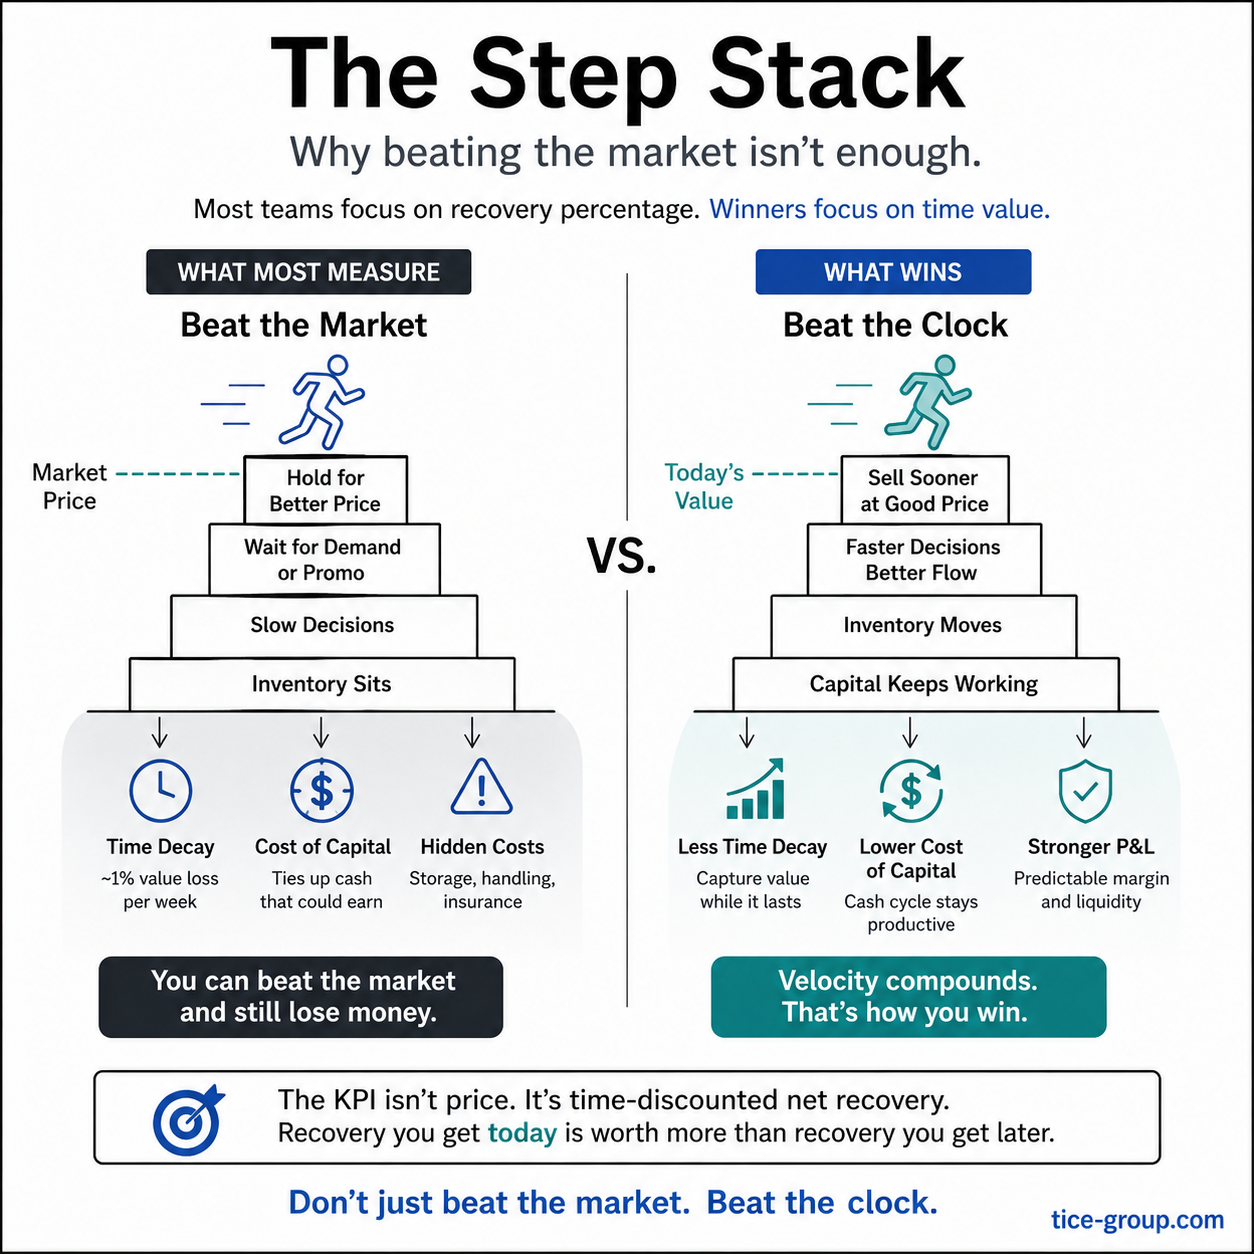
Some time ago I struck a recovery percentage commitment out of an MSA before signing it. I was confident I could hit the number, but I was equally confident it was not the right one to measure us by.
In this case the percentage was 10% on net recovery against MSRP, committed up front, reported quarterly. The kind of number that goes on a slide and looks like accountability. I pushed for open-book reporting instead: every quarter, show the full math. What was held back, what got rerouted, what cleared at what price, what aged out, how long the capital was tied up. The whole picture, not just the headline.
Thankfully in this case, the counterparty was open to it. The honest math turned out to be more useful to both sides than a number that was always going to lie.
That move isn't usually available, granted. Most contracts get signed with the percentage commitment intact because that's what procurement knows how to grade and what Finance knows how to report against. The metric gets baked into the contract before anyone with operational standing is in the room to argue otherwise.
The math underneath
Used inventory drops roughly 1% per week in mobility, faster near launch, slower years out. A $300 device after six weeks is worth around $282. Add storage and insurance, you're under $280. Factor in a 12% cost of capital, and you need to sell for $304.50 just to break even, almost 10% above current market.
Same idea expressed differently: five turns at 12% per turn and three turns at 20% per turn give you the same gross 60% on paper, as a rough baseline (simple multiplication). Once you compound, velocity wins by a few points (1.12⁵ ≈ 76% vs 1.20³ ≈ 73%), a real edge from compounding alone. But the bigger upside isn't on the spreadsheet. The five-turn business has more shots on goal, faster feedback, and less exposure to any single market window. Velocity compounds in ways the percentage doesn't capture.
That's the math. What follows is what happens to operators who haven't internalized it, which still appears to be most of them, and why the system itself keeps producing that gap.
A green dashboard and a bleeding P&L
Years ago I consulted for a recovery operation where the team had been told, in essence, to maximize recovery rate. They were decent operators, and took the directive seriously. Unfortunately, they also didn't have the full picture. So they did exactly what a rational operator does when the metric is recovery rate as a percentage. They held inventory until they could clear it at better prices.
The result was that assets sat. Not for a week or two. The average shelf time crept past 100 days. A third of the year. Four months of devices that should have been moving, instead sitting in a warehouse waiting for better prices that may or may not come.
And the cruel part: when they finally sold, the prices looked good against what comparable devices were clearing for at that moment, technically beating market. The slide didn't look terrible. But beating market at month four was the wrong race entirely; the right benchmark was what those same devices would have cleared three months earlier, before the depreciation curve did its work. The team could honestly tell their reviewers they were hitting their numbers. It was obvious they truly believed they were doing the right thing and actually helping the company.
But that was the wrong comparison. The right comparison is what they could have gotten if they'd moved the inventory three or four months earlier, when the device was newer, the depreciation curve was less brutal, and the capital was still working. Against that benchmark, good prices at the back end was a terrible outcome. They won every individual sale and lost the program.
That doesn't even count the second half of the math. Capital was tied up for months at a stretch. Working capital wasn't moving. The CFO was complaining, rightfully so, that the trade-in program was losing money on a fully-loaded basis even though every operator on the floor was hitting their target. A double whammy: the team held inventory to chase better prices, and the held inventory itself was the cost that made the whole thing unprofitable.
Obviously nobody on that team was being dumb. They were doing exactly what the measurement system rewarded. The dashboard turned green. The P&L turned red. Both were honest reflections of the rules they'd been handed.
And the dashboard doesn't show the invisible risk either. Capital tied up in inventory is capital that's not available for anything else: catching a market shift, funding a new bet, surviving a slow quarter. In one program, the Finance team turned around and sold accounts receivable at a discount just to free up liquidity that was locked in unsold devices on a shelf. They were paying real money to get back cash that should never have left the system in the first place. Even when the trade-in math nets to zero on paper, that hidden liquidity tax is a real cost the program is quietly generating.
Asset velocity is the invisible KPI
That story isn't unique. I've seen the same shape at multiple programs since. The mechanism is always the same: the dashboard rewards a metric that doesn't account for time, so the team optimizes for the metric, and the program quietly bleeds because the dashboard was only asking half the question.
Asset velocity is the invisible KPI: the clock that runs against every percentage on your dashboard. How fast capital cycles. How much value is in motion versus how much is sitting.
It's invisible for a structural reason. Recovery rate as a percentage is easy to put on a dashboard: one number, comparable across periods, intuitive to a Finance reviewer who's never set foot in a warehouse. Days-of-inventory is harder (which devices, which grades, weighted how?). Time-discounted net recovery is harder still (which discount curve, which cost of capital?). Capital turns per year is harder still. Each one is more useful than the last and harder to compute. So the dashboard defaults to the easy thing, and the easy thing is the wrong thing.
The teams that fix this don't do it by working harder. They do it by changing what gets reported. Once time-discounted net recovery (or even just days-of-inventory) appears on the dashboard alongside gross recovery rate, the operator behavior shifts inside of a quarter. The team starts moving aged inventory at lower prices on purpose, because that's what the new metric rewards, and the fully-loaded math improves immediately. Yes, the field hates this at first. It feels like leaving money on the table. The math is honest anyway.
The diagnostic
The diagnostic isn't complicated. Three questions about your current recovery program:
- What metric does the dashboard lead with?
- What operator behavior does that metric reward?
- Does that behavior produce more cash, faster, or just a better-looking number?
If the only metric is recovery rate as a percentage and the behavior is hold for better prices, you're running the program I described above. The dashboard is green and the P&L is bleeding. Nobody is being dumb. The system is doing exactly what you measured it to do.
The fix is to put asset velocity on the dashboard alongside recovery rate. Days-of-inventory, capital turns per year, time-discounted recovery value: pick whichever your team can compute next quarter and start reporting it. The behavior change follows once both numbers are visible.
The reason most programs don't make the switch is that the headline percentage is what got approved, what's in the contract, and what everyone is graded against. Changing it means changing what you say to Finance, what you commit to in MSAs, and what you put on your slide deck. That's the political cost. The economic cost of not changing it is much higher; it just doesn't show up on the dashboard, which is the whole problem.
Open-book reporting in a contract, like the one I struck the percentage out of at the top of this piece, is one of the cleanest ways to align both sides on asset velocity. This can be an internal arrangement too, between operations and finance, not just a contractual one. Neither party can hide behind a headline number. But it requires a customer who actually wants to see the math, and a provider who can produce it. Both are rarer than they should be.
There's a related question worth its own piece: who actually authors these contracts? Procurement defaults to percentage commitments because that's what's grade-able. Finance may default to the same because that's what they can model. Neither department alone usually has the bandwidth to argue for the harder metric, even when they know it's better. The result is a measurement system no one designed but everyone is stuck with.
Recovery rate and asset velocity aren't alternatives. They're two halves of the same measurement, and most dashboards only carry one of them.
Closing the delta is the work.
See where yours stands.
A 4-minute diagnostic shows where your recovery process leaks value. Ready to find out?